Running blocks in the debugger
Canvas lets you run and debug workflow code directly in the browser, simplifying and speeding up development and troubleshooting.
You can use step through the lines of the block code, inspect values and fields, see API requests and responses, filter out data on the fly, and everything else you can do with Javascript in the browser console.
We recommend using the Google Chrome browser for debugging, as these functions have not been thoroughly tested on other browsers.
To debug a block:
- Select the block in the workflow editor.
- Open the Debug tab, to inspect the block code.
- (Optional) Press the square icon in the bottom right corner to maximize the code editor
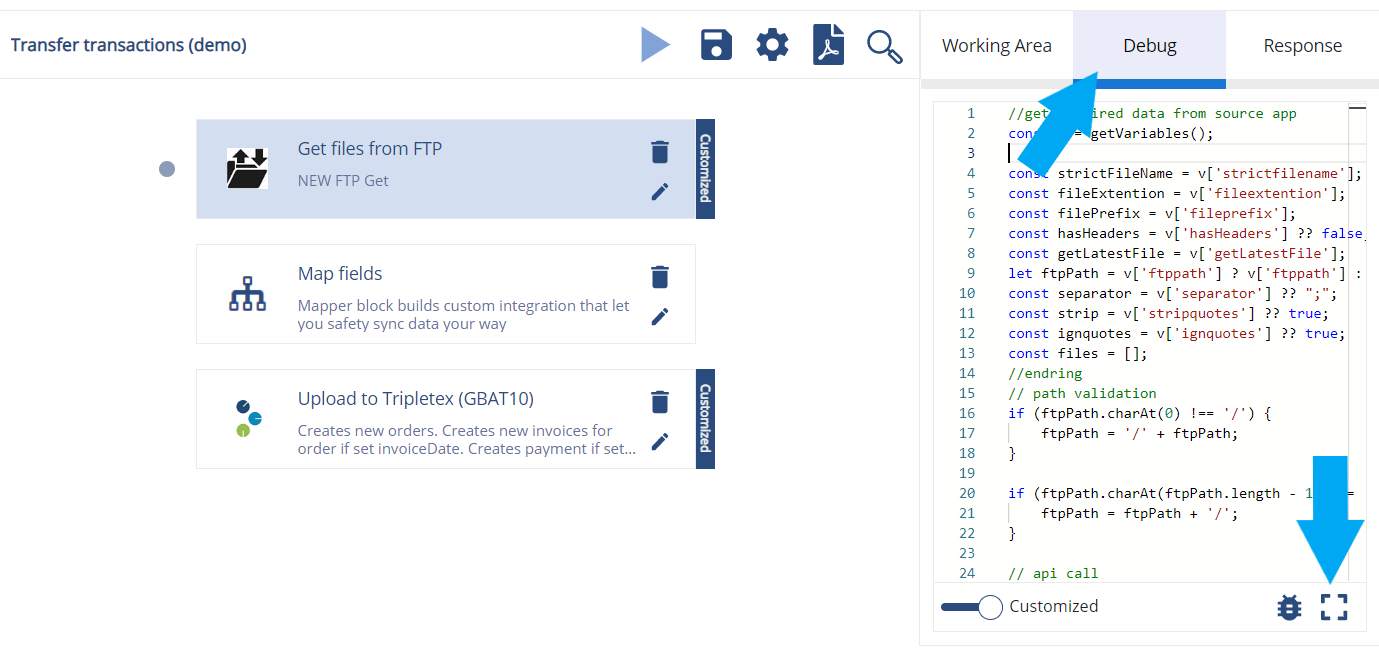 Maximize the code editor with the square icon in the bottom right corner
- Press F12 to open the Chrome developer tools
- Press the little bug icon (see screenshot) to run the code in the Chrome debugger.
Make sure to open the dev tools by pressing F12 before clicking the bug icon. If the bug icon is pressed while the Chrome dev tools are closed, then the block code will run immediately, without the possibility to interrupt or step through the process.
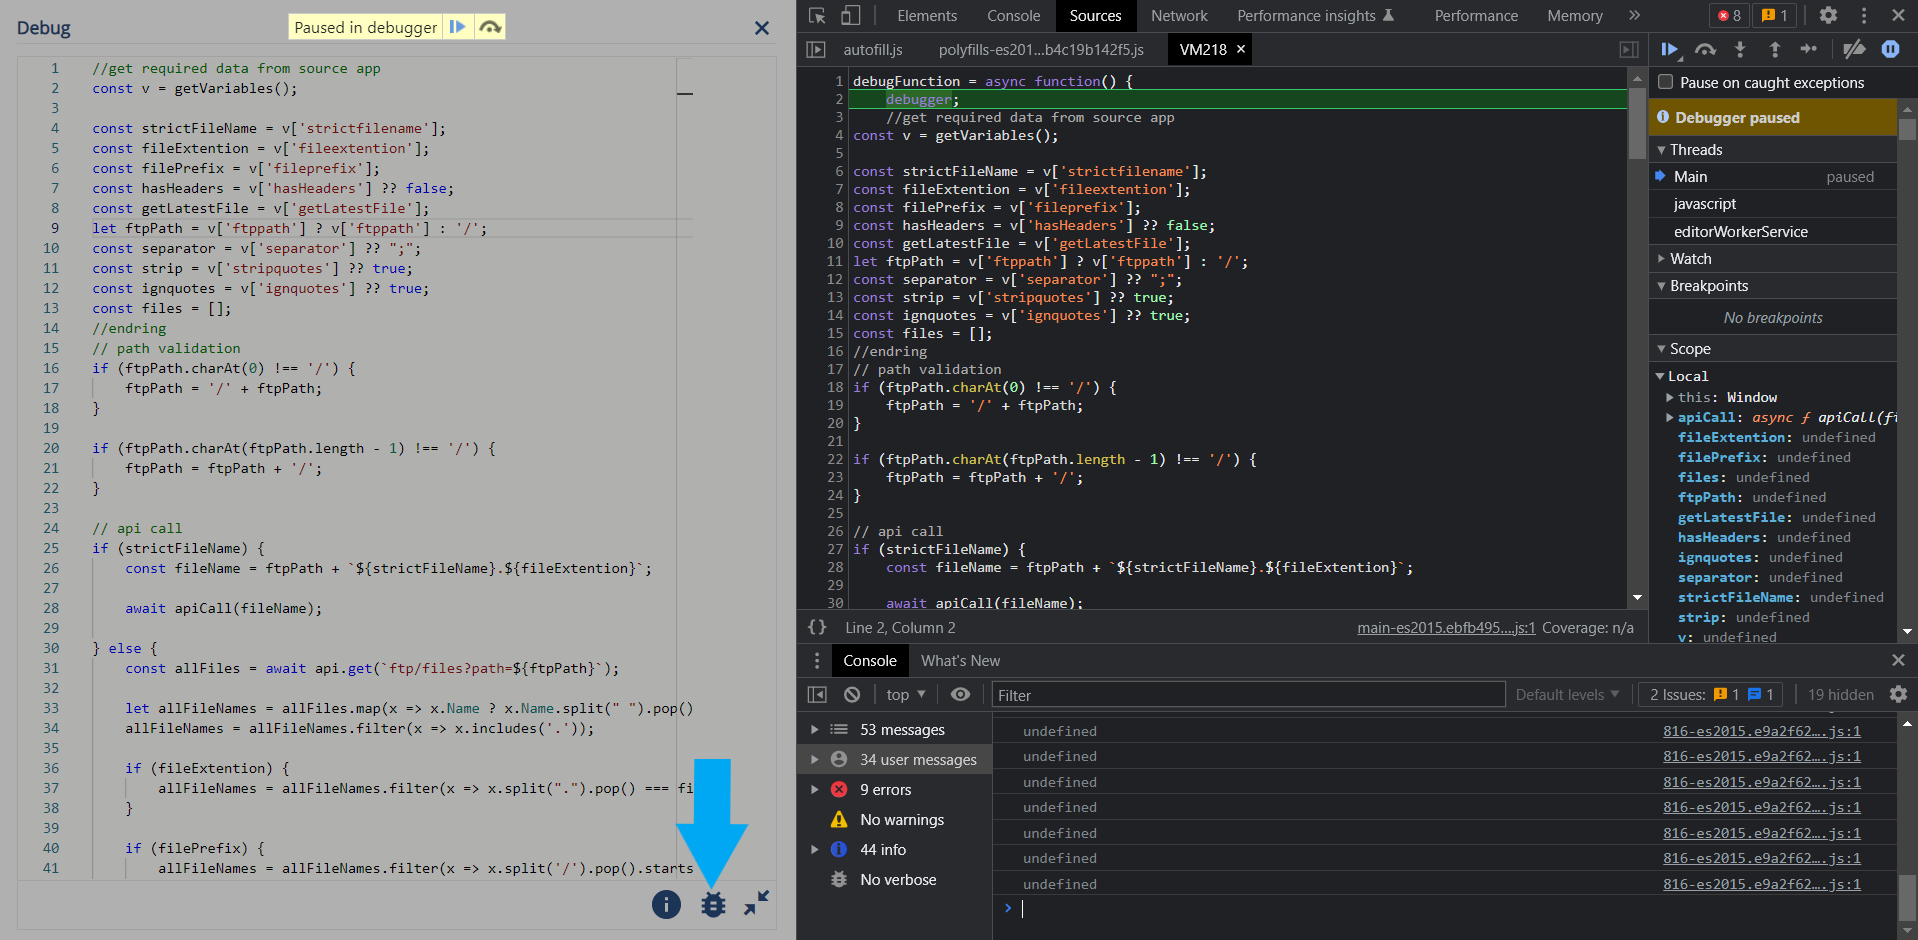 Open the Chrome dev tools with F12, and press the bug icon to start debugging
As you see, the block code has been wrapped in a debugFunction(), and a debugger keyword is added at the top to pause execution.
You can now step through the code by pressing F10, inspect and filter values in the console, and inspect network traffic in the Network tab, among many other things.